• Home
  • About
  • Join Us
  • Contact
Bharat Ideology
  • Insight
  • Culture
  • Economics
  • Parenting
  • Science & Tech
Subscribe
No Result
View All Result
  • Insight
  • Culture
  • Economics
  • Parenting
  • Science & Tech
Subscribe
No Result
View All Result
Bharat Ideology
No Result
View All Result
Home Science & Tech

Histogram using Numpy and OpenCV

by bharatideology
January 10, 2025
in Science & Tech
0
Histogram using Numpy and OpenCV
Share on FacebookShare on Twitter

Histogram Overview

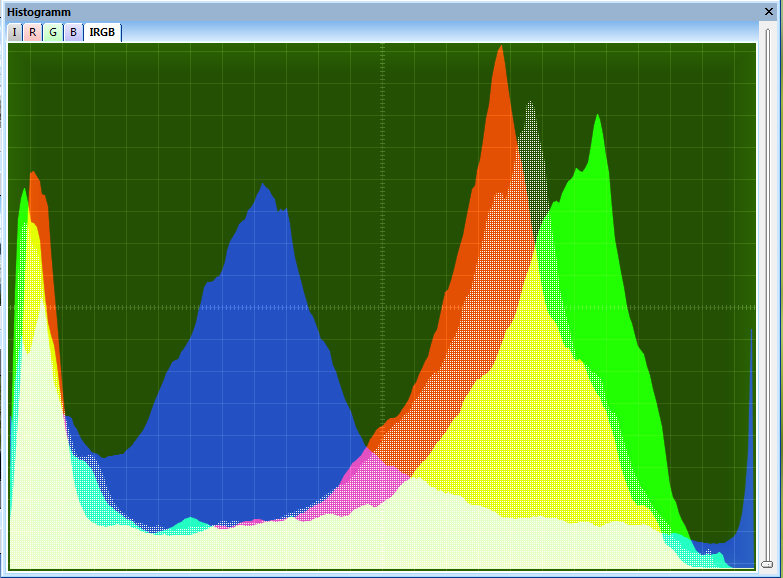
Histogram can be defined as a graph or plot, which gives you an overall idea about the intensity distribution of an image. It is a plot with pixel values (ranging from 0 to 255, not always) in X-axis and corresponding number of pixels in the image on Y-axis.

Histogram Calculation in OpenCV

We can use cv2.calcHist() function to find the histogram. Let’s familiarize with the function and its parameters:

Related articles

India’s Digital Revolution: A Quantum Leap Towards a $5 Trillion Dream

Top 10 Generative AI Tools and Platforms Reshaping the Future

cv2.calcHist(images, channels, mask, histSize, ranges[, hist[, accumulate]])

  • images : it is the source image of type uint8 or float32. it should be given in square brackets, ie, “[img]”.
  • channels : it is also given in square brackets. It is the index of channel for which we calculate histogram. For example, if input is grayscale image, its value is [0]. For color image, you can pass [0], [1] or [2] to calculate histogram of blue, green or red channel respectively.
  • mask : mask image. To find histogram of full image, it is given as “None”. But if you want to find histogram of particular region of image, you have to create a mask image for that and give it as mask.
  • histSize : this represents our BIN count. Need to be given in square brackets. For full scale, we pass [256].say for example, you need to find the number of pixels lying between 0 to 15, then 16 to 31, …, 240 to 255. You will need only 16 values to represent the histogram. ranges : this is our RANGE. Normally, it is [0,256].

Let’s start with a sample image. You have to simply load an image in grayscale mode and find its full histogram. Here hist is a 256×1 array wherein each value corresponds to number of pixels in that image with its corresponding pixel value.

img = cv2.imread('home.jpg',0)

hist = cv2.calcHist([img],[0],None,[256],[0,256])

Histogram Calculation in Numpy

Numpy also provides you a function, np.histogram(). So instead of calcHist() function, you can use the below code :

hist,bins = np.histogram(img.ravel(),256,[0,256])

hist is same as we calculated before. But bins will have 257 elements, because Numpy calculates bins as 0-0.99, 1-1.99, 2-2.99 etc. So final range would be 255-255.99. To represent that, they also add 256 at end of bins. But we don’t need that 256 and upto 255 is sufficient.

Plotting Histograms

We can plot Histogram using Matplotlib plotting functions which is a short and quick way to plot it or we can also use OpenCV drawing functions to plot a Histogram. Let’s understand how to plot a Histogram.

Using Matplotlib

Let’s start with a sample image. You have to simply load an image in grayscale mode and find its full histogram. Here hist is a 256×1 array wherein each value corresponds to number of pixels in that image with its corresponding pixel value. Matplotlib comes with a histogram plotting function : matplotlib.pyplot.hist().It directly finds the histogram and plot it. You need not use calcHist() or np.histogram() function to find the histogram.

See the code below

import cv2

import numpy as np

from matplotlib import pyplot as plt

 img = cv2.imread('home.jpg',0)

 plt.hist(img.ravel(),256,[0,256]); plt.show()

Application of Mask

We used cv2.calcHist() to find the histogram of the full image. In case you want to find histograms of some regions of an image, you can create a mask image with white color on the region you want to find histogram and black otherwise. Then pass this as the mask.

img = cv2.imread('home.jpg',0)  '

# create a mask

 mask = np.zeros(img.shape[:2], np.uint8)

 mask[100:300, 100:400] = 255

masked_img = cv2.bitwise_and(img,img,mask = mask)

 # Calculate histogram with mask and without mask

 # Check third argument for mask

 hist_full = cv2.calcHist([img],[0],None,[256],[0,256])

 hist_mask = cv2.calcHist([img],[0],mask,[256],[0,256])

plt.subplot(221), plt.imshow(img, 'gray')

 plt.subplot(222), plt.imshow(mask,'gray')

 plt.subplot(223), plt.imshow(masked_img, 'gray')

 plt.subplot(224), plt.plot(hist_full), plt.plot(hist_mask)

 plt.xlim([0,256])

plt.show()

Tags: Computer VisionHistogramMatplotlibNumpyOpenCVPython

bharatideology

Related Posts

India’s Digital Revolution: A Quantum Leap Towards a $5 Trillion Dream

India’s Digital Revolution: A Quantum Leap Towards a $5 Trillion Dream

by bharatideology
February 17, 2024
0

The year is 2024, and India stands at a crossroads. The ghosts of the "fragile five" label still linger in the collective memory, but a new...

Top 10 Generative AI Tools and Platforms Reshaping the Future

Top 10 Generative AI Tools and Platforms Reshaping the Future

by bharatideology
January 9, 2025
0

Generative AI, the technology that conjures new ideas and content from thin air, is taking the world by storm. From crafting captivating images to writing eloquent...

Decoding the Future: Gen AI’s Evolution in 2024 – Trends, Strategies, and Business Impact

Decoding the Future: Gen AI’s Evolution in 2024 – Trends, Strategies, and Business Impact

by bharatideology
January 9, 2025
0

Introduction The past year has witnessed an explosive eruption in the realm of Generative AI (Gen AI), propelling it from a nascent technology to a pivotal...

Will Gemini be the AI to Rule Them All? Exploring the Rise of Google’s Multimodal Colossus

Will Gemini be the AI to Rule Them All? Exploring the Rise of Google’s Multimodal Colossus

by bharatideology
January 9, 2025
0

The landscape of Large Language Models (LLMs) has witnessed a rapid evolution, with Google playing a pivotal role in pushing boundaries. Enter Gemini, Google's latest LLM,...

GenAI, LLMs, and Vector Databases: Revolutionizing Recommendation Systems in 2024

GenAI, LLMs, and Vector Databases: Revolutionizing Recommendation Systems in 2024

by bharatideology
January 9, 2025
0

Overview The world of recommendation systems is undergoing a paradigm shift, propelled by the convergence of Generative AI (GenAI) and Large Language Models (LLMs). These powerful...

CATEGORIES

  • Culture
  • Economics
  • Insight
  • Parenting
  • Science & Tech

RECOMMENDED

India’s Startup Revolution: Igniting Innovation and Empowering Entrepreneurs
Economics

India’s Startup Revolution: Igniting Innovation and Empowering Entrepreneurs

February 16, 2024
Rising Icons: How Bharat Mandapam and Yashobhoomi Fuel India’s Global Rise
Economics

Rising Icons: How Bharat Mandapam and Yashobhoomi Fuel India’s Global Rise

January 4, 2024

Twitter Handle

TAGS

Agnipath Ambedkar Panchteerth Artificial Intelligence Ayodhya Ayushman Bharat Backpropogation Bhagwan Birsa Munda Museum CNN CNN Architecture Co-win Computer Vision Consecration Deep Learning Digital India Digital Revolution FutureSkills PRIME GenAI Hornbill Festival Image Segmentation International Space Station LLM Make in India Namami Gange Narendra Modi Neural Network Object Detection OCR OpenCV PLI PM Modi PRASHAD Python Ramayana Ram Mandir Recurrent Neural Network RNN Sangai Festival Semiconductor Shri Ram Janambhoomi Temple Skill India Statue of Unity Swadesh Darshan Tensorflow Vaccine Maitri Women empowerement
Bharat Ideology

Do not be led by others,
awaken your own mind,
amass your own experience,
and decide for yourself your own path - Atharv Ved

© Copyright Bharat Ideology 2023

  • About
  • Disclaimer
  • Terms & Conditions
  • Contact
No Result
View All Result
  • About
  • Contact
  • Disclaimer
  • Home
  • Terms and Conditions of use

© Copyright Bharat Ideology 2023